One topic that comes up frequently when we sit down with taxpayers across Iowa is the number of people our state government employs. Iowans intuitively understand that there are very real and significant costs shouldered by the state for each member of its workforce. For instance, the Legislative Services Agency reports in their most recent Factbook that Iowa spent over $1.5 billion in total compensation just three years ago, accounting for roughly 20% of that year’s state budget. And that doesn’t even count employees at the three regents universities*!
Since more employees equal more state spending and more tax dollars that have to be collected, it is natural for Iowans to be curious about the issue. Unfortunately, our anecdotal evidence gathered one conversation at a time suggests that there is a misunderstanding among the public about what state government’s workforce truly consists of. Most of these conversations start out with an opening along the lines of, “Is it true that Iowa…” or, “Didn’t we used to…” or, our favorite, “I’ve heard that...” From there, who knows what will be repeated to us? But here is the actual data, from the state itself:
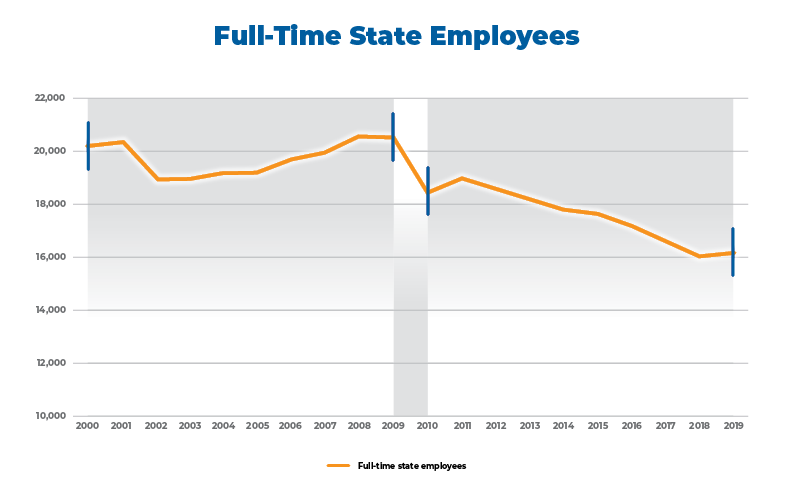
Since the year 2000, the state’s full-time workforce, excluding Board of Regents, Community-Based Corrections, or State Fair Authority employees, was reduced by over 25 percent by the end of 2019. By finding efficiencies, eliminating redundancies, natural attrition, and sometimes simply making do with less, Iowa has found ways to deliver services to its citizens in a way that is mindful of the taxpayer. When examining this data closely, three periods emerge:
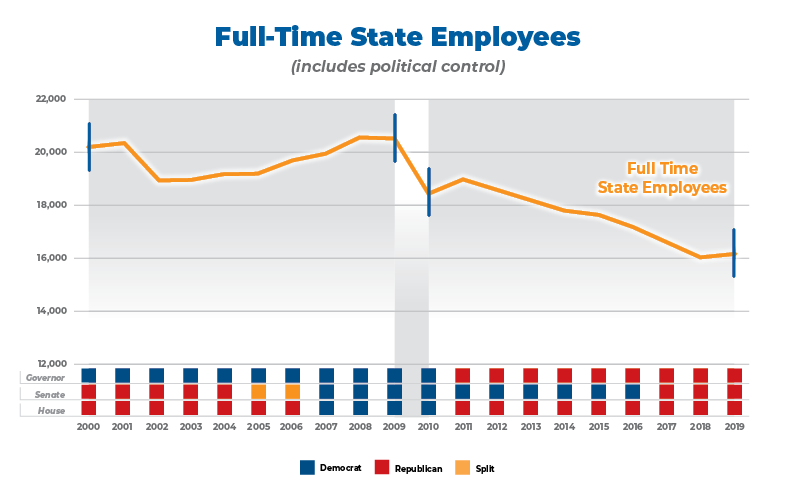
It is interesting to note that control of the Iowa House and Senate has flipped back and forth between Democrats and Republicans multiple times since 2000, meaning one couldn’t fully credit or blame legislators of either party for changes in employees. The political leanings of the governor, however, do seem to come into play here. Understanding that Governor Terry Branstad and Governor Kim Reynolds have vocally advocated for a smaller role for state government, it makes sense that the various department heads they appoint, including for the critical role of leading the Department of Management, would do likewise. Consider the same Full-Time Employees graph again, this time with political control illustrated.
All levels of government should constantly be on the lookout for ways to conserve taxpayer dollars, as well as ensuring that any given activity is truly a function of government in the first place. But the reality in Iowa appears to be that the state is trending in the right direction.
*Why doesn’t the state include Board of Regents employees in the full-time employee data? The short answer is, we don’t know, but we have some guesses. Chief among them is that the University of Iowa, Iowa State University, and the University of Northern Iowa are unique among the various factions of state government. Those schools do not rely solely on the taxpayer for support, as tens of thousands of students pay tuition to attend classes, their athletic departments bring in significant revenue, and they have access to external sources of funding. In fact, Iowa and Iowa State both set funding records for the 2022 fiscal year, receiving $867 million and $602 million, respectively, from sources beyond state government.
After publication of this article, Iowa's Legislative Services Agency provided clarification about the reporting of Board of Regents Employees: "The payroll systems used by the Regents institutions do not calculate FTE positions for their employees. However, each of the institutions calculates FTE positions at the close of each fiscal year to accommodate requirements of the State Budget System. Most faculty members are counted as full-time employees; however, many do not have jobs based on the standard 2,080 hours. In addition, the institutions employ a large number of seasonal employees and students that are difficult to convert to FTE positions. Regents institutions do keep an accurate head count of employees based on the number of paychecks issued. On an annual basis, the three Regents institutions and two special schools employ approximately 45,000 individuals. Of the total, approximately 46.0% represent full-time employees and the remainder consist of part-time, student, and temporary employees."
If you are interested in employment trends at the Regents institutions, LSA has published an excellent report on the topic. Looking only at those individuals whose positions were funded solely with the general education revenues, the total number of employees for all three institutions in FY 2020 was 17,826, an increase of 896 compared to FY 2000.